The DNA Industry and the Disappearing Indian

Posted in Articles, Health/Medicine/Genetics, Law, Media Archive, Native Americans/First Nation, Politics/Public Policy, United States on 2018-12-03 01:40Z by Steven

The DNA Industry and the Disappearing Indian

TomDispatch.com: A regular antidote to the mainstream media
2018-11-29

Aviva Chomsky, Professor of History; Coordinator of Latin American, Latino and Caribbean Studies
Salem State University, Salem, Massachusetts

DNA, Race, and Native Rights

Amid the barrage of racist, anti-immigrant, and other attacks launched by President Trump and his administration in recent months, a series of little noted steps have threatened Native American land rights and sovereignty. Such attacks have focused on tribal sovereignty, the Indian Child Welfare Act (ICWA), and the voting rights of Native Americans, and they have come from Washington, the courts, and a state legislature. What they share is a single conceptual framework: the idea that the long history that has shaped U.S.-Native American relations has no relevance to today’s realities.

Meanwhile, in an apparently unrelated event, Senator Elizabeth Warren, egged on by Donald Trump’s “Pocahontas” taunts and his mocking of her claims to native ancestry, triumphantly touted her DNA results to “prove” her Native American heritage. In turning to the burgeoning, for-profit DNA industry, however, she implicitly lent her progressive weight to claims about race and identity that go hand in hand with moves to undermine Native sovereignty.

The DNA industry has, in fact, found a way to profit from reviving and modernizing antiquated ideas about the biological origins of race and repackaging them in a cheerful, Disneyfied wrapping. While it’s true that the it’s-a-small-world-after-all multiculturalism of the new racial science rejects nineteenth-century scientific racism and Social Darwinism, it is offering a twenty-first-century version of pseudoscience that once again reduces race to a matter of genetics and origins. In the process, the corporate-promoted ancestry fad conveniently manages to erase the histories of conquest, colonization, and exploitation that created not just racial inequality but race itself as a crucial category in the modern world.

Today’s policy attacks on Native rights reproduce the same misunderstandings of race that the DNA industry is now so assiduously promoting. If Native Americans are reduced to little more than another genetic variation, there is no need for laws that acknowledge their land rights, treaty rights, and sovereignty. Nor must any thought be given to how to compensate for past harms, not to speak of the present ones that still structure their realities. A genetic understanding of race distorts such policies into unfair “privileges” offered to a racially defined group and so “discrimination” against non-Natives. This is precisely the logic behind recent rulings that have denied Mashpee tribal land rights in Massachusetts, dismantled the Indian Child Welfare Act (a law aimed at preventing the removal of Native American children from their families or communities), and attempted to suppress Native voting rights in North Dakota

Read the entire article here.

Tags: , , , , , , ,

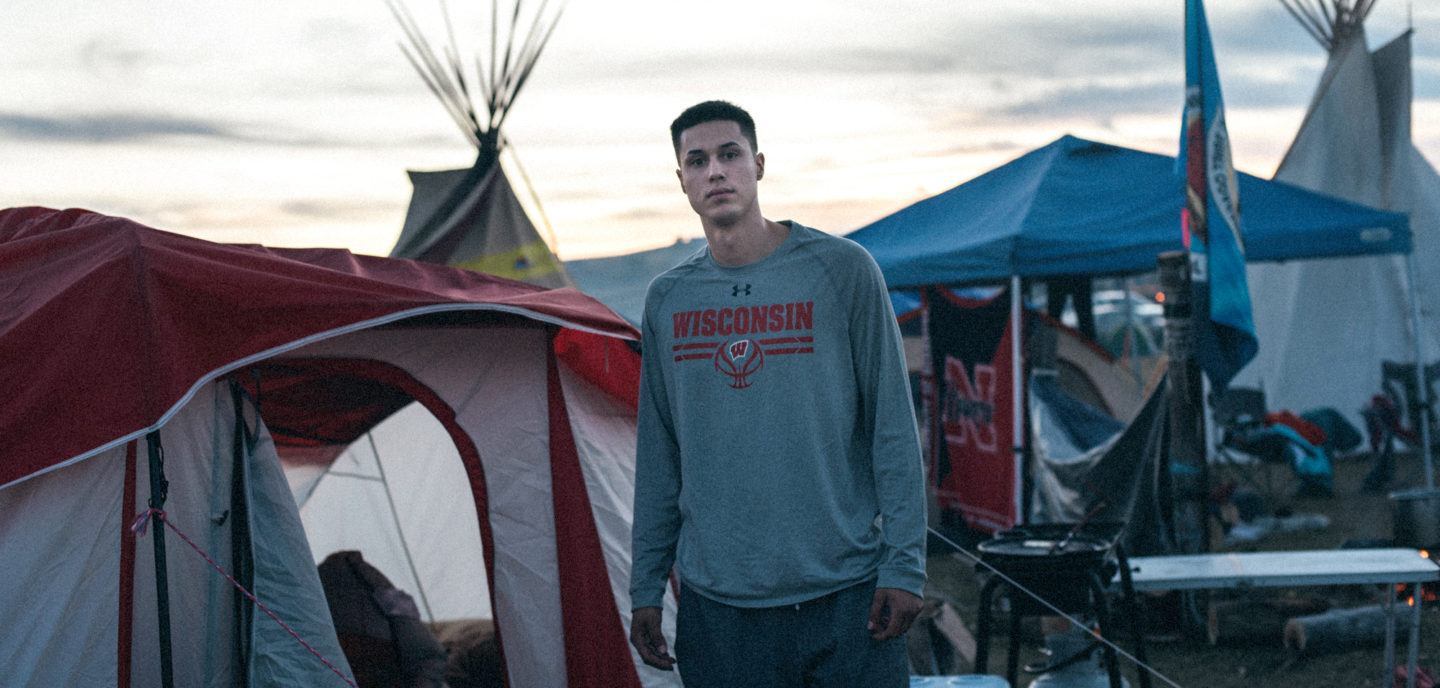
What I Found in Standing Rock

Posted in Articles, Autobiography, Media Archive, Native Americans/First Nation, United States on 2016-12-12 00:03Z by Steven

What I Found in Standing Rock

The Players’ Tribune
2016-12-01

Bronson Koenig, Guard
Wisconsin Badgers


Photos by Alexandra Hootnick/The Players’ Tribune

Near the edge of the Standing Rock camp in North Dakota, about 50 yards from a tributary of the Missouri River, there’s a basketball hoop. It’s one of those worn-out outdoor hoops that leans forward a little bit, almost as if the wind had bent it.

In September, I drove from my home state of Wisconsin to the Standing Rock reservation, land of the Hunkpapa Sioux. I got in after dark so I didn’t see the layout of the whole camp until the sun rose the next morning. When I unzipped my tent, I saw a valley full of Native people — thousands of people camping out in tents, RVs and teepees — from over 300 tribes. There were license plates from almost every state.

They’d come to protest the Dakota Access Pipeline, an underground oil pipeline being constructed less than a half mile from the reservation. The tribe says the pipeline will plow through ancient burial grounds and could poison the reservation’s water supply, as well as the water supply of millions of people downriver.

In the morning air I smelled burning sage, the plant used during Native American spiritual ceremonies. A woman walked by with a shirt that read THIS IS OUR LAND, and a couple of kids on horses trotted past. Someone was giving directions to a communal kitchen and generators were humming nearby. I saw some flags flying upside down, the signal for distress. I could hear Sioux singers and the unmistakable thumping of drums. It sounded like a battle cry…

…I’m one of about 60 Native American students at the University of Wisconsin–Madison, a school with more than 30,000 undergrads, and one of only about 40 Native American Division I men’s college basketball players in the country. I’m not too surprised that almost no one at school knew much about the Ho-Chunk tribe. My whole life, I’ve had friends and classmates ask me the most basic questions about my heritage. Did I wear feathers? Do my parents run a casino? One high school classmate even admitted that he didn’t think Indian reservations still existed. Before I got to college, I had rarely ever heard a mention of Native American history in school — all I remember from 11th grade is some reading about Native American agriculture and a couple of paragraphs in a history book on the Trail of Tears, the forced march on which all those people died in the winter of 1838…

Read the entire article here.

Tags: , , , , , ,

Comparative studies of full and mixed blood North Dakota Indians

Posted in Anthropology, Articles, Media Archive, Native Americans/First Nation, United States on 2011-10-27 02:02Z by Steven

Comparative studies of full and mixed blood North Dakota Indians

Psychological Monographs
Volume 50, Number 5 (1938)
pages 116-129
DOI: 10.1037/h0093522

C. W. Telford

The early comparative studies of Indian-white mixtures in America uniformly reported superior mental test performances of mixed as compared with full blood Indians. The tests used in these investigations were principally standard group intelligence tests of the language type, which reflect very markedly the different social, cultural, and educational backgrounds of the subjects. In this investigation the Peterson Rational Learning Test was used, an ideational learning test which seems to draw little on past experience and training, and which stimulates the subjects to approximately maximal effort throughout the performance. The subjects of the present study were students of the various Indian schools of North Dakota and of one school on the Fort Peck Indian Reservation in Eastern Montana. The degrees of Indian blood represented by the subjects were obtained from the government records. Positive values indicate that the mixed bloods excel while negative values show full blood superiority. Unless a minus sign appears before a figure, the value will be assumed to be positive. In other words, as the tests become more and more of the informational and achievement nature, the differences increasingly favor the mixed blood; or, conversely, as the tests depend more and more on basic learning and manipulative abilities, the differences between the two groups tend to disappear.

Read or purchase the article here.

Tags: , ,

Test performance of full and mixed-blood North Dakota Indians

Posted in Anthropology, Articles, Media Archive, Native Americans/First Nation, United States on 2011-10-27 01:54Z by Steven

Test performance of full and mixed-blood North Dakota Indians

Journal of Comparative Psychology
Volume 14, Number 1 (August 1932)
pages 123-145
DOI: 10.1037/h0069966

C. W. Telford

225 Indian pupils scattered through the kindergarten to the sixth grade, inclusive, were given the Goodenough intelligence test. The average IQ of the Indian children was 88, as compared with 100 for whites and 77-79 for negroes. The rational learning test, the mare and foal test, and the Healy puzzle “A” test were given to 35 12-year-olds. The Indians were superior to whites on the mare and foal test. On the Healy “A” test they were intermediate between whites and negroes. This was true for the rational learning test. The differences between Indians and whites were greater for speed than accuracy. There was no correlation of any significance between performance and amount of Indian blood.

Read or purchase the article here.

Tags: , ,

Census Bureau Reports Final 2010 Census Data for the United States

Posted in Articles, Census/Demographics, Louisiana, Media Archive, Mississippi, Texas, United States, Virginia on 2011-03-25 02:15Z by Steven

Census Bureau Reports Final 2010 Census Data for the United States

United States Census Bureau
Census 2010
2011-03-24

The U.S. Census Bureau announced today that 2010 Census population totals and demographic characteristics have been released for communities in all 50 states, the District of Columbia and Puerto Rico. These data have provided the first look at population counts for small areas and race, Hispanic origin, voting age and housing unit data released from the 2010 Census. With the release of data for all the states, national-level counts of these characteristics are now available.

For each state, the Census Bureau will provide summaries of population totals, as well as data on race, Hispanic origin and voting age for multiple geographies within the state, such as census blocks, tracts, voting districts, cities, counties and school districts.

According to Public Law 94-171, the Census Bureau must provide redistricting data to the 50 states no later than April 1 of the year following the census. As a result, the Census Bureau is delivering the data state-by-state on a flow basis. All states will receive their data by April 1, 2011.

Highlights by Steven F. Riley

  • The United States population (for apportionment purposes)  is 308,745,538. This represents a 9.71% increase over 2000.
  • The U.S. population including Puerto Rico is 312,471,327.  This represents a 9.55% increase over 2000.
  • The number of repondents (excluding Puerto Rico) checking two or more races (TOMR) is 9,009,073 or 2.92% of the population. This represents a 31.98% increase over 2000.
  • The number of repondents (including Puerto Rico) checking TOMR is 9,026,389 or 2.89% of the population.  This represents a 29.23% increase over 2000.
  • Hawaii has the highest TOMR response rate at 23.57%, followed by Alaska (7.30%), Oklahoma (5.90%) and California (4.87%).
  • California has the highest TOMR population at 1,815,384, followed by Texas (679,001), New York (585,849), and Florida (472,577).
  • Mississppi has the lowest TOMR response rate at 1.15%, followed by West Virginia (1.46%),  Alabama (1.49%) and Maine (1.58%).
  • Vermont has the lowest TOMR population at 10,753, followed by North Dakota (11,853), Wyoming (12,361) and South Dakota (17,283).
  • South Carolina has the highest increase in the TOMR response rate at 100.09%, followed by North Carolina (99.69%), Delaware (83.03%) and Georgia (81.71%).
  • New Jersey has the lowest increase in the TOMR response rate at 12.42%, followed by California (12.92%), New Mexico (16.11%), and Massachusetts (17.81%).
  • Puerto Rico has a 22.83% decrease in the TOMR response rate and New York has a 0.73% decrease in the TOMR response race.  No other states or territories reported decreases.
2010 Census Data for “Two or More Races” for States Above
# State Total Population Two or More Races (TOMR) Percentage Total Pop. % Change from 2000 TOMR % Change from 2000
1. Louisiana 4,533,372 72,883 1.61 1.42 51.01
2. Mississippi 2,967,297 34,107 1.15 4.31 70.36
3. New Jersey 8,791,894 240,303 2.73 4.49 12.42
4. Virginia 8,001,024 233,400 2.92 13.03 63.14
5. Maryland 5,773,552 164,708 2.85 9.01 59.00
6. Arkansas 2,915,918 72,883 2.50 9.07 59.50
7. Iowa 3,046,355 53,333 1.75 4.10 67.83
8. Indiana 6,483,802 127,901 1.97 6.63 69.02
9. Vermont 625,741 10,753 1.71 2.78 46.60
10. Illinois 12,830,632 289,982 2.26 3.31 23.38
11. Oklahoma 3,751,351 221,321 5.90 8.71 41.89
12. South Dakota 814,180 17,283 2.12 7.86 70.18
13. Texas 25,145,561 679,001 2.70 20.59 31.93
14. Washington 6,724,540 312,926 4.65 14.09 46.56
15. Oregon 3,831,074 144,759 3.78 11.97 38.20
16. Colorado 5,029,196 172,456 3.43 16.92 41.14
17. Utah 2,763,885 75,518 2.73 23.77 60.01
18. Nevada 2,700,551 126,075 4.67 35.14 64.96
19. Missouri 5,988,927 124,589 2.08 7.04 51.82
20. Alabama 4,779,736 71,251 1.49 7.48 61.28
21. Hawaii 1,360,301 320,629 23.57 12.28 23.63
22. Nebraska 1,826,341 39,510 2.16 6.72 64.95
23. North Carolina 9,535,483 206,199 2.16 18.46 99.69
24. Delaware 897,934 23,854 2.66 14.59 83.03
25. Kansas 2,853,118 85,933 3.01 6.13 52.10
26. Wyoming 563,626 12,361 2.19 14.14 39.15
27. California 37,253,956 1,815,384 4.87 9.99 12.92
28. Ohio 11,536,504 237,765 2.06 1.59 50.59
29. Connecticut 3,574,097 92,676 2.59 4.95 23.82
30. Pennsylvania 12,702,379 237,835 1.87 3.43 67.23
31. Wisconsin 5,686,986 104,317 1.83 6.03 55.94
32. Arizona 6,392,017 218,300 3.42 24.59 48.98
33. Idaho 1,567,582 38,935 2.48 21.15 52.04
34. New Mexico 2,059,179 77,010 3.74 13.20 16.11
35. Montana 989,415 24,976 2.52 9.67 58.78
36. Tennessee 6,346,105 110,009 1.73 11.54 74.32
37. North Dakota 672,591 11,853 1.76 4.73 60.22
38. Minnesota 5,303,925 125,145 2.36 7.81 51.25
39. Alaska 710,231 51,875 7.30 13.29 51.92
40. Florida 18,801,310 472,577 2.51 17.63 25.58
41. Georgia 9,687,653 207,489 2.14 18.34 81.71
42. Kentucky 4,339,367 75,208 1.73 7.36 77.20
43. New Hampshire 1,316,470 21,382 1.62 6.53 61.81
44. Michigan 9,883,640 230,319 2.33 -0.55 19.70
45. Massachusetts 6,547,629 172,003 2.63 3.13 17.81
46. Rhode Island 1,052,567 34,787 3.30 0.41 23.14
47. South Carolina 4,625,364 79,935 1.73 15.29 100.09
48. West Virginia 1,852,994 27,142 1.46 2.47 71.92
49. New York 19,378,102 585,849 3.02 2.12 -0.73
50. Puerto Rico 3,725,789 122,246 3.28 -2.17 -22.83
51. Maine 1,328,361 20,941 1.58 4.19 65.58
52. District of Columbia 601,723 17,316 2.88 5.19 71.92
Total (with Puerto Rico) 312,471,327 9,026,389 2.89 9.55 29.23
U.S. Population 308,745,538 9,009,073 2.92 9.71 31.98

Tables compiled by Steven F. Riley. Source: United States Census Bureau

2000 Census Data for “Two or More Races” for States Above
# State Total Population Two or More Races (TOMR) Percentage
1. Louisiana 4,469,976 48,265 1.08
2. Mississippi 2,844,658 20,021 0.74
3. New Jersey 8,414,250 213,755 2.54
4. Virginia 7,078,515 143,069 2.02
5. Maryland 5,296,486 103,587 1.96
6. Arkansas 2,673,400 35,744 1.34
7. Iowa 2,926,324 31,778 1.09
8. Indiana 6,080,485 75,672 1.24
9. Vermont 608,827 7,335 1.20
10. Illinois 12,419,293 235,016 1.89
11. Oklahoma 3,450,654 155,985 4.52
12. South Dakota 754,844 10,156 1.35
13. Texas 20,851,820 514,633 2.47
14. Washington 5,894,121 213,519 3.62
15. Oregon 3,421,399 104,745 3.06
16. Colorado 4,301,261 122,187 2.84
17. Utah 2,233,169 47,195 2.11
18. Nevada 1,998,257 76,428 3.82
19. Missouri 5,595,211 82,061 1.47
20. Alabama 4,447,100 44,179 0.99
21. Hawaii 1,211,537 259,343 21.41
22. Nebraska 1,711,263 23,953 1.40
23. North Carolina 8,049,313 103,260 1.28
24. Delaware 783,600 13,033 1.66
25. Kansas 2,688,418 56,496 2.10
26. Wyoming 493,782 8,883 1.80
27. California 33,871,648 1,607,646 4.75
28. Ohio 11,353,140 157,885 1.39
29. Connecticut 3,405,565 74,848 2.20
30. Pennsylvania 12,281,054 142,224 1.16
31. Wisconsin 5,363,675 66,895 1.25
32. Arizona 5,130,632 146,526 2.86
33. Idaho 1,293,953 25,609 1.98
34. New Mexico 1,819,046 66,327 3.65
35. Montana 902,195 15,730 1.74
36. Tennessee 5,689,283 63,109 1.11
37. North Dakota 642,200 7,398 1.15
38. Minnesota 4,919,479 82,742 1.68
39. Alaska 626,932 34,146 5.45
40. Florida 15,982,378 376,315 2.35
41. Georgia 8,186,453 114,188 1.39
42. Kentucky 4,041,769 42,443 1.05
43. New Hampshire 1,235,786 13,214 1.07
44. Michigan 9,938,444 192,416 1.94
45. Massachusetts 6,349,097 146,005 2.30
46. Rhode Island 1,048,319 28,251 2.69
47. South Carolina 4,012,012 39,950 1.00
48. West Virginia 1,808,344 15,788 0.87
49. New York 18,976,457 590,182 3.11
50. Puerto Rico 3,808,610 158,415 4.16
51. Maine 1,274,923 12,647 0.99
52. District of Columbia 572,059 13,446 2.35
Total (with Puerto Rico) 285,230,516 6,984,643 2.45
  United States 281,421,906 6,826,228 2.43

Tables compiled by Steven F. Riley.  Source: United States Census Bureau

Tags: , , , , , , , , , , , , , , , , , , , , , , , , , , , , , , , , , , , , , , , , , , , , , , ,