America’s Churning Races: Race and Ethnicity Response Changes Between Census 2000 and the 2010 Census

Posted in Articles, Asian Diaspora, Census/Demographics, Latino Studies, Media Archive, United States on 2017-07-14 16:58Z by Steven

America’s Churning Races: Race and Ethnicity Response Changes Between Census 2000 and the 2010 Census

Demography
February 2017, Volume 54, Issue 1
pages 259–284
DOI: 10.1007/s13524-016-0544-0

Carolyn A. Liebler, Professor of Sociology
University of Minnesota

Sonya R. Porter
Center for Administrative Records Research and Applications
U.S. Census Bureau, Suitland, Maryland

Leticia E. Fernandez
Center for Administrative Records Research and Applications
U.S. Census Bureau, Suitland, Maryland

James M. Noon, Survey Statistician
Center for Administrative Records Research and Applications
U.S. Census Bureau, Suitland, Maryland

Sharon R. Ennis, Statistician
Center for Administrative Records Research and Applications
U.S. Census Bureau, Suitland, Maryland

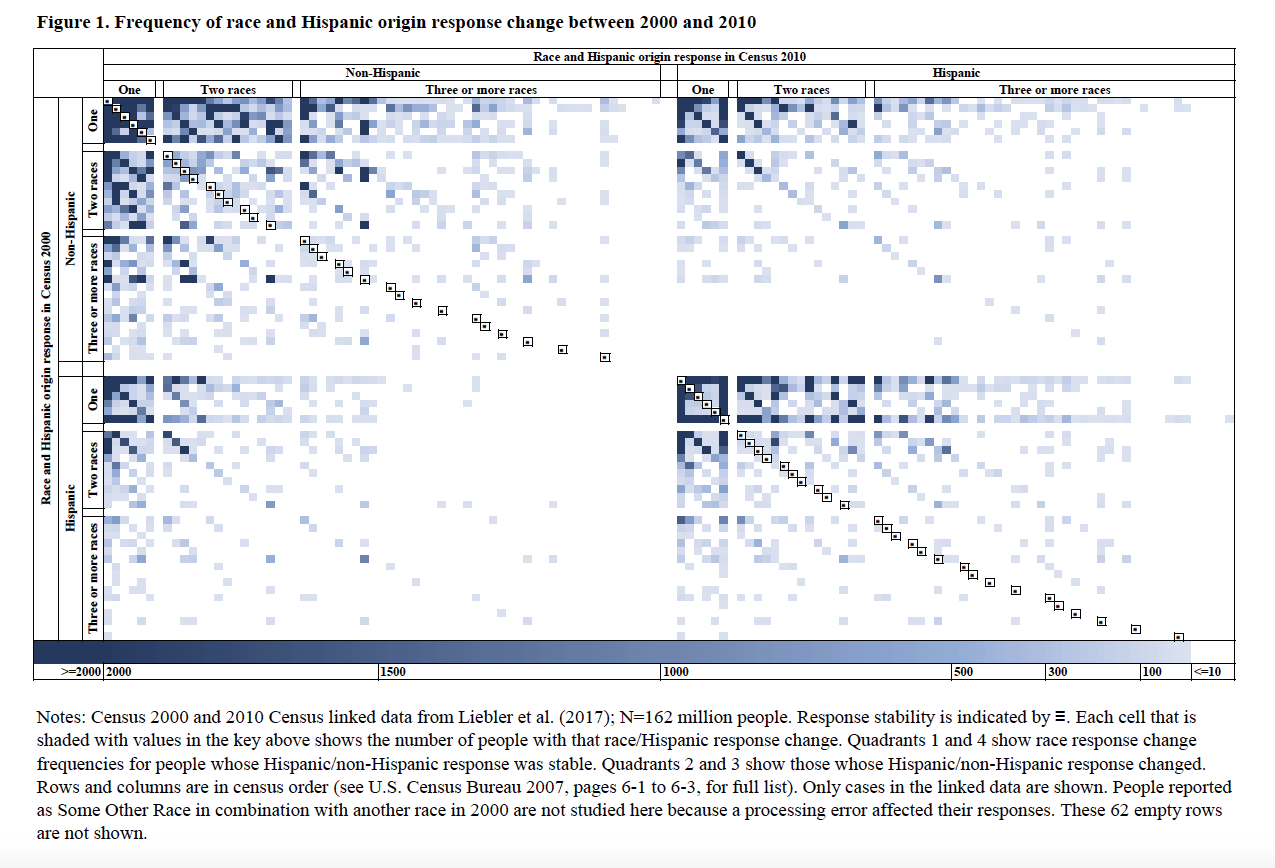
A person’s racial or ethnic self-identification can change over time and across contexts, which is a component of population change not usually considered in studies that use race and ethnicity as variables. To facilitate incorporation of this aspect of population change, we show patterns and directions of individual-level race and Hispanic response change throughout the United States and among all federally recognized race/ethnic groups. We use internal U.S. Census Bureau data from the 2000 and 2010 censuses in which responses have been linked at the individual level (N = 162 million). Approximately 9.8 million people (6.1%) in our data have a different race and/or Hispanic-origin response in 2010 than they did in 2000. Race response change was especially common among those reported as American Indian, Alaska Native, Native Hawaiian, Other Pacific Islander, in a multiple-race response group, or Hispanic. People reported as non-Hispanic white, black, or Asian in 2000 usually had the same response in 2010 (3%, 6%, and 9% of responses changed, respectively). Hispanic/non-Hispanic ethnicity responses were also usually consistent (13% and 1%, respectively, changed). We found a variety of response change patterns, which we detail. In many race/Hispanic response groups, we see population churn in the form of large countervailing flows of response changes that are hidden in cross-sectional data. We find that response changes happen across ages, sexes, regions, and response modes, with interesting variation across racial/ethnic categories. Researchers should address the implications of race and Hispanic-origin response change when designing analyses and interpreting results.

Read or purchase the article here.

Tags: , , , , , , , , , , , ,

The Head of the Census Resigned. It Could Be as Serious as James Comey

Posted in Articles, Census/Demographics, Media Archive, Politics/Public Policy, United States on 2017-05-14 19:20Z by Steven

The Head of the Census Resigned. It Could Be as Serious as James Comey

TIME
2017-05-12

Haley Sweetland Edwards


John Thompson, Director, U.S. Census Bureau
U.S. Census Bureau

In a week dominated by President Trump’s firing of FBI director James Comey, you could be forgiven for missing the imminent departure of another, less prominent federal official.

Yet the news this week that John H. Thompson, the director of the Census Bureau, has abruptly resigned is arguably as consequential to the future of our democracy. That’s because the Census Bureau, while less flashy than the FBI, plays a staggeringly important role in both U.S. elections and an array of state and federal government functions.

“At the very heart of the Census is nothing less than political power and money,” said Terri Ann Lowenthal, who served as the staff director of the House census oversight subcommittee before becoming a consultant on census policy and operational issues. “It is the basis, the very foundation, of our democracy and the Constitution’s promise of equal representation.”

The results of the decennial Census—the next will be in 2020—will determine how state and federal political districts are drawn; which Americans are “counted” for representation; and how federal dollars, many of which are allocated on a per capita basis, are spent…

Read the entire article here.

Tags: , , , , , , , , ,

Departure of U.S. Census director threatens 2020 count

Posted in Articles, Census/Demographics, Media Archive, Politics/Public Policy, United States on 2017-05-11 02:01Z by Steven

Departure of U.S. Census director threatens 2020 count

Science
2017-05-09

Jeffrey Mervis


John Thompson will leave the Census Bureau on 30 June. U.S. Census Bureau

John Thompson is stepping down next month as director of the U.S. Census Bureau. His announcement today comes less than 1 week after a congressional spending panel grilled him about mounting problems facing the agency in preparing for the 2020 decennial census. And Thompson’s pending retirement is weighing heavily on the U.S. statistical community.

Thompson is leaving halfway through a 1-year extension of a term that expired last December. His departure will create what a 2011 law was expressly designed to avoid—a leadership vacuum during a crucial time in the 10-year life cycle of the census, the nation’s largest civilian undertaking. The immediate concern is who the Trump administration will appoint, and how soon it will act…

Ken Prewitt, who led the agency from 1998 to 2001, worries that a long delay in naming a well-qualified replacement for Thompson could be the first step of a long, steep decline in the quality of the federal statistic system, which spans 13 agencies. “That system is fragile, and it wouldn’t take much to damage it severely,” says Prewitt, a professor of social affairs at Columbia University. “My real fear is that they don’t care enough to do a good job with the 2020 census. And then after doing a bad job, they decide to let the private sector take over.”…

Read the entire article here.

Tags: , , , , , , , , ,

Census Bureau Statement on Classifying Filipinos

Posted in Articles, Asian Diaspora, Census/Demographics, Media Archive, United States on 2015-11-23 02:14Z by Steven

Census Bureau Statement on Classifying Filipinos

United States Census Bureau
2015-11-09
Release Number: CB15-RTQ.26

Public Information Office: 301-763-3030

NOV. 9, 2015 — The Census Bureau has no current plans to classify Filipinos outside of the Asian race category. Filipinos are classified as Asian on Census Bureau forms based on the Office of Management and Budget’s definition, which specifically states that people whose origins are from the Philippine Islands are part of the category Asian.

According to OMB, Asian refers to a person having origins in any of the original peoples of the Far East, Southeast Asia, or the Indian subcontinent, including, for example, Cambodia, China, India, Japan, Korea, Malaysia, Pakistan, the Philippine Islands, Thailand and Vietnam.

At this time, the Census Bureau is conducting the 2015 National Content Test and is testing the design of the race question for the 2020 Census. This test will frame the recommendations for the 2020 Census race question, which has Filipino as an example under the Asian category.

Tags: , , ,

Census change may result in fewer ‘white’ Americans

Posted in Articles, Census/Demographics, Media Archive, United States on 2015-11-22 22:15Z by Steven

Census change may result in fewer ‘white’ Americans

The Los Angeles Times
2015-11-22

Associated Press

The Census Bureau is considering changes to its race and ethnicity questions that would reclassify some minorities who were considered “white” in the past, a move that may speed up the date when America’s white population falls below 50%.

Census Director John Thompson told the Associated Press that the bureau is testing a number of new questions and may combine its race and ethnicity questions into one category for the 2020 census. That would allow respondents to choose multiple races.

The possible changes include allowing Latinos to give more details about their ethnic backgrounds and creating a distinct category for people of Middle Eastern and North African descent…

William Frey, a demographer for the Brookings Institution’s Metropolitan Policy Program, says the proposed changes would grant residents more freedom to define their races and ethnicities.

“I don’t know if this will make a huge difference in the 2020 census on whites becoming the minority, but it could later,” said Frey, author of “Diversity Explosion: How New Racial Demographics Are Remaking America.”

In the past, “white” was the only racial option available to Arab American respondents, a classification that didn’t truly reflect their social standing and hurt efforts for their political empowerment in post-Sept. 11 America, said Samer Khalaf, president of the American-Arab Anti-Discrimination Committee.

“If you are going to classify me as white, then treat [me] as white,” Khalaf said. “Especially when I go to the airport. So, yeah, it’s inaccurate.”…

Read the entire article here.

Tags: , , , , , , , ,

Every term the Census has used to describe America’s racial and ethnic groups since 1790

Posted in Articles, Census/Demographics, History, Media Archive, United States on 2015-11-06 03:01Z by Steven

Every term the Census has used to describe America’s racial and ethnic groups since 1790

The Washington Post
2015-11-04

Laris Karklis, Deputy Graphics Director

Emily Badger, Urban Policy Writer


This chart is based on an interactive the Census Bureau published this week tracing the history of these changes, from the proliferation of new racial and ethnic identities (now the government counts Chicanos, Puerto Ricans, Cubans and Guatemalans) through the revision of old ones (“Indians” have become “American Indians”).

From the moment of the first American census, in 1790, through every decennial census we’ve had since, the categories the U.S. government has used to classify its residents have included the word “white.”

That label has been the lone constant in an ever-evolving checklist of identities that reflect the changing demographics of this country — and the changing language the government has used to define it. In 1790, the three categories available were “free white females and males,” “all other free persons” and “slaves.” By 1830, that last category had splintered into “slaves” and “free colored persons.” By 1890, the census separately counted blacks — now all legally free — as “blacks,” “mulattos,” “quadroons” and “octoroons.”…

Read the entire article here.

Tags: , , , ,

An Insidious Way to Underrepresent Minorities

Posted in Articles, Census/Demographics, Latino Studies, Media Archive, Politics/Public Policy, United States on 2015-11-06 02:10Z by Steven

An Insidious Way to Underrepresent Minorities

The American Prospect
2015-11-05

Gary D. Bass, Executive Director
Bauman Foundation, Washington, D.C.

Adrien Schless-Meier, Program Associate
Bauman Foundation, Washington, D.C.

Cuts in U.S. Census funding threaten to produce an undercount of minorities and the poor and to reduce their share of federal aid.

African Americans, Hispanics, and other minority populations are in danger of losing representation in Congress as well as their share of more than $400 billion a year in federal funds for health care, education, job training, and community development. That possibility should get anyone’s attention, yet few have noticed that it will be the likely result if Congress cuts the budget for the U.S. Census Bureau to the extent it now threatens to do.

The Constitution requires a decennial census to determine congressional apportionment, and federal law relies on the numbers to allocate funds among states and localities. Historically, the census has missed large numbers of people in poverty and racial and ethnic minorities. By the 2000 and 2010 censuses, however, the national undercount had dropped to less than 2 percent, due primarily to the Census Bureau’s dogged determination to walk America’s streets and knock on the doors of the roughly 100 million U.S. residents who didn’t mail back their forms. Racial and ethnic minorities were still more likely to be missed than whites. But the Census Bureau could not have reduced the disparity in counting minorities without budgetary support.

Now, Congress is insisting that the Census Bureau spend less preparing for and conducting the 2020 census than it did on the 2010 census, even though the U.S. population is expected to have grown by more than 25 million people by 2020. The bureau has chosen not to fight this directive, which census experts call delusional. Instead, the bureau has embarked on a high-risk strategy to save $5 billion by rolling back door-to-door canvassing and conducting a largely electronic, Internet-based census…

…Adding to this uncertainty, and on top of the technology overhaul, the Census Bureau is exploring significant changes in the way it asks about race and ethnicity, which also need prior testing. The right changes could improve the quality of race and ethnicity data, but at least one approach under consideration—relying on write-in responses instead of check boxes—would do the opposite, according to civil-rights advocates…

Resolving Confusion about Race and Ethnicity

The census might be the best source of data on race and ethnicity, but it is by no means perfect, and respondents often are confused about how to identify themselves. As currently designed, the survey first asks whether the respondent is of Hispanic, Latino, or Spanish origin, and then offers a series of check boxes for Mexican, Puerto Rican, Cuban, or other Hispanic origin, with a write-in box. The next question asks for the respondent’s race, with check boxes for white, black, American Indian or Alaska Native, seven Asian nationalities, four Pacific Islander groups, or “some other race,” followed by a write-in box.

About 20 million people in 2010 checked the “some other race” box—making it the third most selected race category behind white and black—and the vast majority of those were Hispanic. Vargas, who serves on the Census Bureau’s advisory committee examining the race and ethnicity question, summed up the challenge: “Once you’ve asked, are you Hispanic, yes or no, and they answer yes, I’m Mexican American, they go to the next question and are asked, so what’s your race. And people are like, wait a minute, you just asked me that. I just told you I’m Mexican. And the bureau would say, no, being Hispanic is an ethnicity. It’s not a racial category. But they don’t see themselves in the white, black, Asian, [or] Native American categories.”…

Read the entire article here.

Tags: , , , , ,

The Two or More Races population is projected to be the fastest growing over the next 46 years…, with its population expected to triple in size (an increase of 226 percent).

Posted in Excerpts/Quotes on 2015-03-03 20:36Z by Steven

The Two or More Races population is projected to be the fastest growing over the next 46 years (see Table 2), with its population expected to triple in size (an increase of 226 percent). This group is projected to increase from 8 million to 26 million between 2014 and 2060. Its share of the total population is projected to increase from 2.5 percent.

Sandra L. Colby and Jennifer M. Ortman, “Projections of the Size and Composition of the U.S. Population: 2014 to 2060: Population Estimates and Projections [P25-1143],” United States Census Bureau, Washington, D.C. (March 3, 2015). 9. http://www.census.gov/content/dam/Census/library/publications/2015/demo/p25-1143.pdf.

Tags: , , , , , ,

Projections of the Size and Composition of the U.S. Population: 2014 to 2060: Population Estimates and Projections

Posted in Census/Demographics, Media Archive, Reports, United States on 2015-03-03 20:04Z by Steven

Projections of the Size and Composition of the U.S. Population: 2014 to 2060: Population Estimates and Projections

United States Census Bureau
March 2015
P25-1143
13 pages

Sandra L. Colby and Jennifer M. Ortman

INTRODUCTION

Between 2014 and 2060, the U.S. population is projected to increase from 319 million to 417 million, reaching 400 million in 2051. The U.S. population is projected to grow more slowly in future decades than in the recent past, as these projections assume that fertility rates will continue to decline and that there will be a modest decline in the overall rate of net international migration. By 2030, one in five Americans is projected to be 65 and over; by 2044, more than half of all Americans are projected to belong to a minority group (any group other than non-Hispanic White alone); and by 2060, nearly one in five of the nation’s total population is projected to be foreign born.

This report summarizes results from the U.S. Census Bureau’s 2014 National Projections, with a focus on changes in the age structure and shifts in the racial and ethnic composition of the population—both the total population as well as the native and foreign born…

…The Two or More Races population is projected to be the fastest growing over the next 46 years (see Table 2), with its population expected to triple in size (an increase of 226 percent). This group is projected to increase from 8 million to 26 million between 2014 and 2060. Its share of the total population is projected to increase from 2.5 percent…

Read the entire report here.

Tags: , , , , , ,

Mapping Interracial/Interethnic Married-Couple Households in the United States: 2010

Posted in Census/Demographics, Media Archive, Papers/Presentations, Reports, United States on 2014-03-04 21:53Z by Steven

Mapping Interracial/Interethnic Married-Couple Households in the United States: 2010

United States Census Bureau
Presented at the Annual Meeting of the Population Association of America
New Orleans, Louisiana
2013-04-11 through 2013-04-13

Tallese D. Johnson, Population Division
U.S. Census Bureau

Rose M. Kreider, Social, Economic, and Housing Statistics Division
U.S. Census Bureau

Introduction

This poster examines the geographic distribution of interracial and interethnic married couples in the United States. The analysis focuses on county level distributions that map the prevalence of specific combinations of interracial/interethnic married couples, such as Whites married to Asians. The county maps illustrate the diversity of interracial/interethnic couple combinations around the country. Much of the literature on interracial or interethnic married couples shows all such couples together. However, particular intermarried combinations have distinct histories and distributions across the United States.

Given distinct paths of entry into the United States, internal migration patterns, and residential segregation, we would expect that White/Black couples may tend to live in different areas than White/Asian couples, for example. Couples with a relatively longer history of intermarriage, such as Hispanic/non-Hispanic couples or White/American Indian and Alaska Native couples may have distinct patterns of residence. This poster provides basic information about where particular intermarried couples live, by county, across the United States…

View the poster and maps here.

Tags: , , , , ,